 September 2026
Patent Licensing Royalty Rates by Industry (SEC Data)
Search for patent licensing royalty rates by industry and you get the same table everywhere. Semiconductors low, software high, pharma somewhere in between. The table is not wrong. It is just answering a different question from the one a licensor is asking.
Those bands blend every kind of deal into one number per sector: exclusive product licences with engineering support, settlement agreements, and bare patent licences where nothing but the right to practise the claims changes hands. Pull the deals apart and a more useful picture appears. Industry sets the neighbourhood. The kind of licence you are offering sets the address.
Here is what the published data says for each sector, and how to find the number that belongs to your patent.
Royalty rates by industry at a glance
The most widely quoted bands come from survey summaries, which put software and SaaS at roughly 5 to 8 percent, pharmaceuticals and biotech at 4 to 6 percent, medical devices at 3 to 5 percent, electronics and chemicals at 2 to 4 percent, automotive and industrial at 1 to 3 percent, and semiconductors at 1 to 2 percent. The source itself labels them survey figures without per-row provenance.
For measured numbers, the best free dataset is a study of 2,963 royalty-bearing licences filed with the US Securities and Exchange Commission from 1994 to 2009, including more than 800 previously redacted agreements obtained under the Freedom of Information Act. It reports medians by industry and, crucially, by type of licence. Averages sit above the medians in almost every cell, a sign of a long right tail.
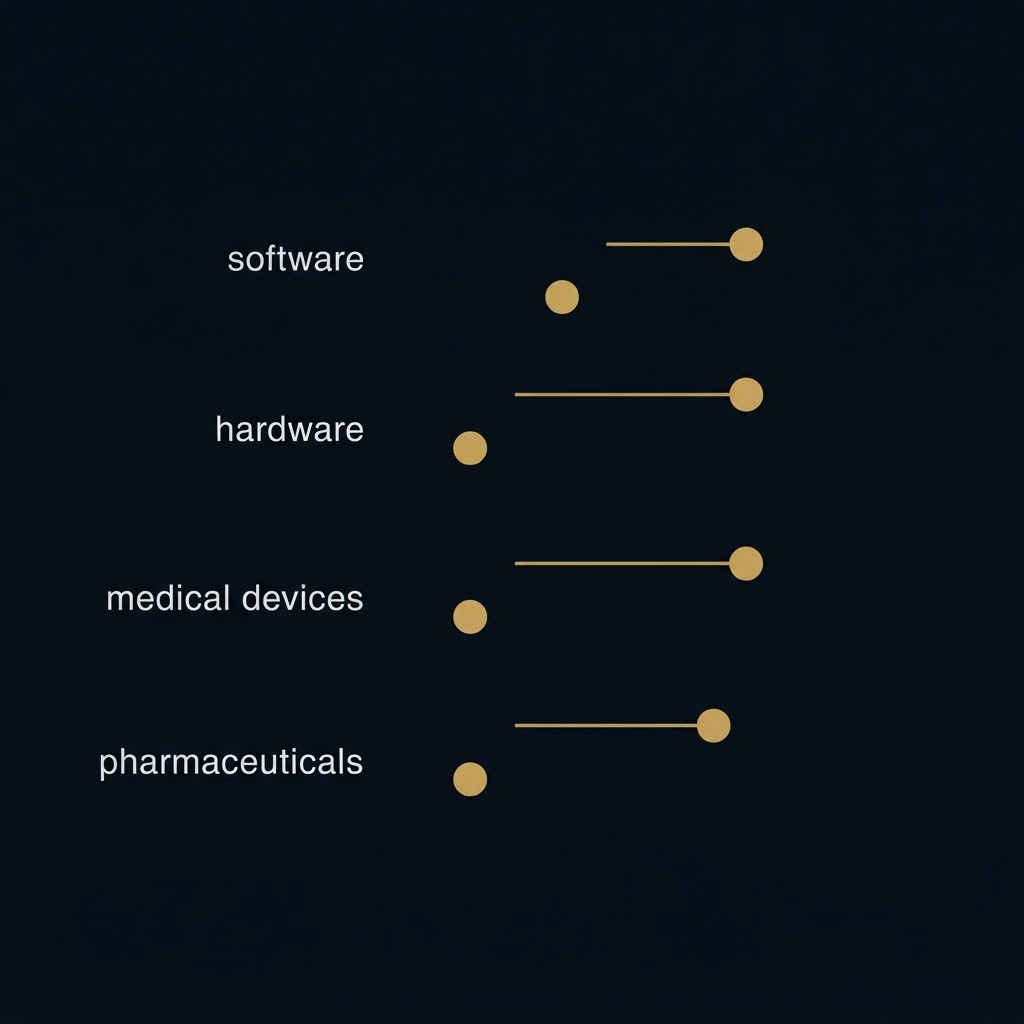
| Industry | Published band | Bare patent median | Patent plus know-how median |
|---|---|---|---|
| Software | 5 to 8% | 3.0% (17 deals) | 4.0% (17 deals) |
| Hardware and electronics | 2 to 4% | 3.5% (56 deals) | 4.4% (95 deals) |
| Medical devices | 3 to 5% | 3.5% (73 deals) | 5.0% (109 deals) |
| Pharmaceuticals | 4 to 6% | 3.0% (197 deals) | 4.5% (349 deals) |
| All industries | 3 to 6% | 3.0% (343 deals) | 4.5% (570 deals) |
Look down the bare patent column. Across four very different industries the median barely moves, from 3.0 to 3.5 percent. The spread in the published bands comes mostly from what else travels with the patent.
The paid benchmark most practitioners buy, the RoyaltySource summary, covers 14 industries over more than 30 years with averages, medians and interquartile ranges, drawn from SEC EDGAR filings and other public records. If you need a defensible figure for a valuation report, that interquartile range is worth the fee. For a first negotiation position, the free data above gets you most of the way.
What the data says, sector by sector
Pharmaceuticals and biotech
A separate study by Micronomics of 90 pharmaceutical licences found a mean of 5.66 percent and a median of 4.38 percent, with 3 percent the single most common rate; averages rose from 5.21 percent in the 1980s and early 1990s to 8.52 percent in agreements from 2002 to 2006, while 77 medical device licences averaged 4.35 percent with a 4 percent median and 21 chemical licences averaged 3.70 percent with a 3 percent median.
Two cautions. Most of those agreements bundled know-how, copyright or trademarks with the patent. And stage matters more in pharma than anywhere else: a compound in late clinical development licenses on different terms from an early molecule. The published bands note late-stage assets reach double digits. A preclinical patent does not.
Medical devices
Devices look steady at 3 to 5 percent in almost every source, but the sub-rows show a gap worth knowing. In the SEC dataset, electromedical apparatus licences with know-how had a 5.0 percent median against 2.0 percent for bare patents. That is the widest know-how premium in the study. A device patent without the clinical data, design files or regulatory history behind it is a much smaller asset to a licensee.
Software
Software carries the highest headline band and one of the lowest bare patent medians. The reason is the deal mix. Software product and distribution licences in the SEC data had a median of 14.4 percent, pulling the sector average up, while a patent-only software licence sat at 3.0 percent. Sample sizes for software patent licences are small, so treat that 3 percent as indicative rather than settled.
Margins explain why software can pay more when the patent covers a real share of the product. Benchmark tools tie rates to gross margin, around 80 percent in software against around 12.5 percent in automotive, with royalties above 3 to 5 percent seriously eroding profit in thin-margin sectors; standard-essential telecom patents instead use per-unit fees such as 2.50 to 5.00 dollars per 5G device or 20 to 32 dollars per connected vehicle.
Electronics, hardware and semiconductors
Semiconductors are the low end for a structural reason: many patents read on one chip, and each patent is a small slice of the product's value. In the SEC data, semiconductor licences with know-how had a median of 3.5 percent and bare patent licences 2.4 percent. Broader hardware, which includes electronic components, instrumentation and telecom equipment, sat at 3.5 percent for bare patents.
Chemicals
Chemicals cluster tightly. The Micronomics sample put most rates between 3 and 6 percent with a 3 percent median. Process patents often compete with alternative routes to the same product, which caps what a licensee will pay.
Automotive, telecom and aerospace
Automotive sits low because margins are thin and a car combines a great many patented features. Telecom has largely left percentage rates behind for the per-unit fees above.
Aerospace is the surprise. In the combined Licensing Executives Society surveys, aerospace technology had the highest average royalty rate at 10.7 percent, and aerospace, software, medical and healthcare technologies all carried significant royalty premiums, as did exclusive licences and fully developed technology. Few licensees, long qualification cycles and high switching costs reward a patent that is already designed in.
Why deal type moves the rate more than industry
The SEC study is blunt about it. Across all industries, median rates ran from 3.0 percent for bare patent licences to 10.0 percent for product and distribution licences, more than a threefold gap, and that ranking held in every industry examined. No industry spread in the table above comes close.
Four patterns from the same dataset matter for pricing:
- Know-how earns a premium. Patent plus know-how licences had a 4.5 percent median against 3.0 percent for bare patents across all industries.
- Settlements run higher, with a catch. Patent settlement agreements had medians 2.0 points above bare patent licences. The author warns that settlements a patent holder lost are unlikely to be filed at all, so the premium is inflated by selection.
- Who licenses matters. Commercial licensors achieved higher median rates than individuals, universities, government agencies and non-profits.
- The data skews high. Only agreements material enough to disclose reach the SEC, and the author notes that rates across firms' whole licensing portfolios are typically lower.
That last point is the one inventors most often miss. Every free benchmark above is drawn from deals big enough to report. A single family licensed by an individual to a mid-sized manufacturer starts from the lower end, not the midpoint.
Using an industry benchmark for one patent family
A useful rule: pick the column before the row. What you are licensing decides more of the rate than where the licensee sells.
Find your column before your row
If you are offering the right to practise the claims and nothing else, you are in the bare patent column, around 3 percent in most sectors. Then adjust for industry: down in semiconductors and automotive, up in devices and aerospace. Then adjust for exclusivity and development stage. We cover those adjustments, the royalty base and the retired 25 percent rule in our guide to what actually moves a licensing rate. If you are also unsure which average you are quoting, negotiated, court-awarded or per-unit, settle that first.
Pending applications price below the band
Every figure in this article comes from licences of issued rights or of technology already in use. A pending application has not survived examination and its claims may narrow. Price it below the bare patent median for its industry, and expect terms that step up on grant rather than a single fixed rate.
Carve the rights instead of stretching the rate
When the industry band feels too low, owners usually push the rate. Licensees push back, because they compare you against the same tables. The better lever is scope. At EX-IX we license held rights carved by industry, territory or field of use while title stays whole. A medical device field and an industrial field for the same family are two licences, each priced against its own row.
Strength moves you up within a band too. Before a patent reaches a licensee, our validation gate runs detectability analysis and validity probability, benchmarked at 0.76 percent mean absolute percentage error against real-world outcomes. A licensee who can see that use of the invention is observable prices the risk of ignoring it accordingly.
If the realistic royalty in your sector will not cover renewal fees, compare the licence with what a patent sells for outright. Either way, value the patent first and choose the benchmark that matches the asset you actually hold.
FAQ
Which industry has the highest patent royalty rates?
Aerospace had the highest average in the combined LES surveys at 10.7 percent. In SEC-filed agreements, software product and distribution licences had the highest medians, but patent-only software licences were close to the all-industry figure.
Why are semiconductor royalty rates so low?
Many patents can read on one chip, so each patent covers a small share of the product's value and licensees resist stacking royalties. In the SEC data the bare patent median for semiconductors was 2.4 percent.
Are royalty rates from SEC filings representative of all licences?
Not fully. Companies only file agreements material to their business, which skews the sample towards larger, higher-rate deals. Rates across whole licensing portfolios are typically lower, so treat SEC medians as a ceiling for small deals.
Do universities and individual inventors get lower royalty rates?
On average, yes. Commercial licensors achieved higher median rates than individuals, universities, government agencies and non-profits in the SEC dataset, likely reflecting more developed technology and stronger negotiating positions.
We use essential cookies to operate this website and, with your consent, optional cookies to understand site usage. You can accept or decline non-essential cookies at any time. See our Impressum for our contact and legal details.